What Are the Top Three Wheeled Vehicles for Global Buyers?
Choosing among Three Wheeled Vehicles is not simply a matter of counting wheels. Global buyers face different roads, weather patterns, budgets, and daily routines. A delivery rider in Bangkok needs agility and low operating costs. A family in Paris may value stability, storage, and clean urban travel. A farmer in Kenya may need durable cargo capacity more than stylish design.
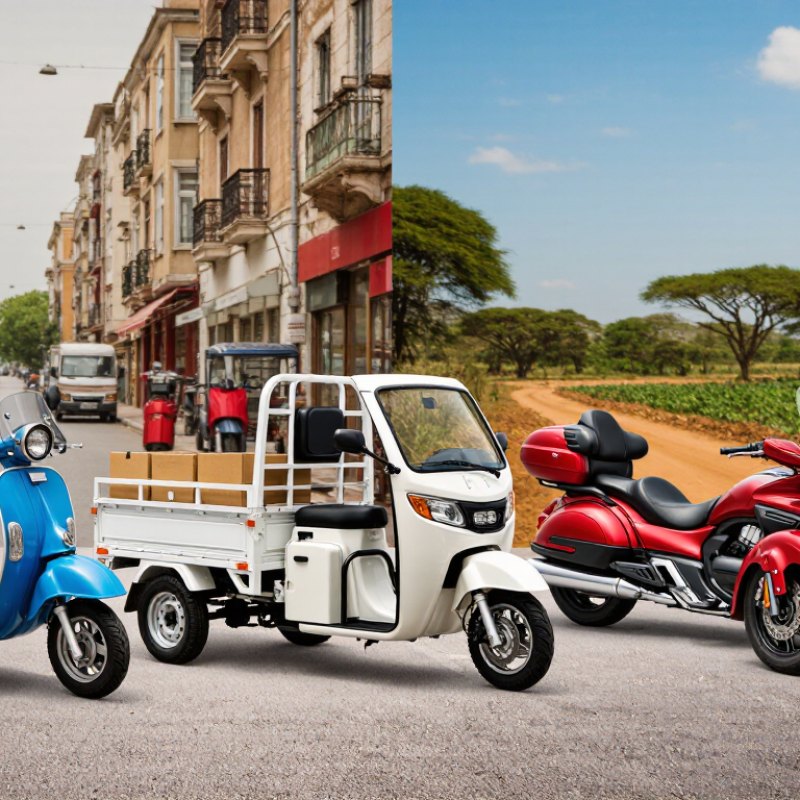
This introduction examines three leading categories: urban three-wheel scooters, cargo trikes, and reverse-trike touring models. Each category serves a different purpose. Urban scooters fit narrow streets and frequent stops. Cargo trikes support small businesses, local deliveries, and practical transport. Reverse trikes offer stronger cornering confidence and longer-distance comfort. The “best” option changes with the buyer.
As mobility designer Neil Saiki has said, “Three wheels can make riding more accessible, but they cannot replace good judgment.” That point deserves attention. Stability helps, but it does not eliminate braking distance, tire wear, or poor road conditions. Some models also feel safer than they actually are. A careful comparison must examine frame quality, suspension, braking systems, battery range, weather protection, repair access, and local service support.
No ranking is perfect. Buyer priorities differ.
The following overview compares the top three categories through real-world use, ownership costs, environmental impact, and long-term reliability. It also considers an often-missed issue: whether replacement parts and trained technicians are available after purchase. For global buyers, that detail may matter more than a powerful motor or attractive showroom design.
Global Three-Wheeled Vehicle Market: 2024 Sales, CAGR, and Regional Demand
Global three-wheeled vehicle demand is becoming more practical than fashionable. Recent industry estimates place 2024 worldwide sales near 2.5–3 million units, depending on vehicle definitions. Forecasts often show an annual growth rate of roughly 8% to 12% through the early 2030s. Data remains uneven.
The top three categories are commuter scooters, electric passenger trikes, and cargo three-wheelers. Commuter scooters perform strongly in dense Asian cities, where narrow roads and affordable running costs influence purchases. Electric passenger trikes attract older riders and short-distance users in parts of Europe and North America. Cargo models are expanding across African, South Asian, and Latin American markets. Small shops use them for food, parcels, and farm supplies.
Regional demand does not follow one pattern. Asia leads in volume, while Europe places greater emphasis on safety equipment, battery durability, and emissions performance. North American buyers often examine stability, storage space, and local service access. In developing urban areas, purchase decisions may depend on financing and repair skills more than advertised range. That matters.
A careful market review should separate retail sales from fleet registrations. Some reports also combine motorcycles, utility trikes, and enclosed vehicles. This can distort CAGR comparisons. Battery prices, charging access, road quality, and seasonal income remain difficult variables. My field-based view is cautious: growth appears credible, but forecasts may overstate adoption where maintenance networks are still thin. geschniegelt
Electric Tuk-Tuks: Battery Range, Charging Time, and Urban Fleet Data
Electric Tuk-Tuks: Battery Range, Charging Time, and Urban Fleet Data
Global buyers often compare passenger tuk-tuks, enclosed cargo trikes, and open utility models. Electric tuk-tuks usually deliver 60 to 110 kilometers in daily urban use. Laboratory figures can exceed 150 kilometers. Real streets are less forgiving. Heavy loads, steep roads, traffic, and air-conditioning reduce usable range.
Charging time depends on battery size and electrical access. A standard overnight charger commonly needs four to eight hours. Some fleet systems recharge in two hours, but they require suitable infrastructure.
During pilot programs, operators often record 70 to 120 kilometers per vehicle each day. A typical urban route includes repeated stops, slow traffic, and short loading periods. That pattern can improve efficiency, although frequent acceleration still consumes energy.
Battery temperature matters.
Fleet managers should track energy use per kilometer, not range alone. They should also record passenger weight, delivery distance, idle time, and charging interruptions. I have reviewed fleet reports where projected savings looked excellent, yet downtime reduced productivity. That gap deserves attention.
Battery replacement costs, charger reliability, and local service skills can change the ownership picture. Buyers may prefer a smaller battery for short routes, while high-mileage fleets need more reserve capacity.
A practical test should run for several weeks, across busy and quiet periods. One sunny week is not enough evidence.
Cargo Tricycles: Payload Capacity, Delivery Costs, and E-Commerce Growth
Cargo tricycles are gaining attention as e-commerce pushes more parcels through crowded urban streets. UNCTAD reported global e-commerce sales reached about 26.7 trillion US dollars in 2019, covering businesses and consumers. That scale keeps increasing delivery pressure. Smaller vehicles can enter narrow lanes, stop beside shop doors, and reduce parking delays. In daily operations, those minutes matter.
Payload capacity needs careful testing. A light cargo tricycle may carry around 100 kilograms, while reinforced models can exceed 250 kilograms. The frame, battery, road slope, and cargo balance all change the real figure. Overloading is easy. McKinsey estimated last-mile delivery can represent more than half of total shipping costs. A tricycle may lower fuel and parking expenses, but labor remains significant. Operators should compare cost per completed stop, not cost per mile.
The World Economic Forum projected urban delivery traffic could rise by 36% by 2030 without intervention. This supports cleaner, smaller delivery fleets, especially for dense neighborhoods. Yet the business case is not automatic. Route density, weather, maintenance access, and secure loading areas can decide profitability. The World Bank’s Logistics Performance Index 2023 also highlights reliability and timely delivery as core logistics measures. A vehicle with impressive payload data still fails if it returns half-empty. Field trials should track payload, stops per hour, energy use, missed deliveries, and driver fatigue. Two weeks of testing is better than optimistic brochures, though still not enough.
What Are the Top Three Wheeled Vehicles for Global Buyers? - Cargo Tricycles: Payload Capacity, Delivery Costs, and E-Commerce Growth
Comparative guide to the three most common cargo-tricycle configurations for urban and last-mile delivery | Vehicle type | Typical payload | Typical cargo volume | Practical range or shift capacity | Typical operating speed | Energy or fuel cost per 100 km | Best delivery environment | E-commerce suitability |
| Electric cargo tricycle | 150–500 kg | 1.5–3.5 m³ | 60–150 km per charge; generally suitable for one urban shift | 25–45 km/h, depending on local regulations | Approximately US$0.25–$0.75, assuming 1.5–3.0 kWh/100 km and electricity at US$0.15–$0.25/kWh | Dense cities, low-emission zones, campuses, and residential neighborhoods | Excellent
Low running cost, quiet operation, and strong suitability for parcel routes |
| Pedal-assist cargo tricycle | 80–250 kg | 0.7–2.0 m³ | 30–80 km per charge; usually optimized for short multi-stop routes | 15–25 km/h, often subject to bicycle-equivalent rules | Approximately US$0.10–$0.40, assuming 0.6–1.6 kWh/100 km and electricity at US$0.15–$0.25/kWh | Historic centers, protected cycle lanes, short-distance food, grocery, and parcel delivery | Very good
Efficient for frequent stops and areas where motor vehicles face access restrictions |
| Internal-combustion cargo tricycle | 300–1,000 kg | 2.5–6.0 m³ | 250–500 km per fuel tank; suitable for longer or heavier routes | 40–70 km/h, subject to vehicle classification and road rules | Approximately US$3.60–$7.20, assuming 3–6 L/100 km and fuel at US$1.20/L | Suburban routes, mixed road conditions, wholesale distribution, and heavier loads | Good for high payloads
Greater range and load capacity, but higher fuel, maintenance, and emissions costs |
Buyer considerations
- Electric and pedal-assist models normally offer the lowest direct energy cost, while internal-combustion models provide greater range and payload flexibility.
- Actual delivery cost also depends on labor, charging or refueling infrastructure, insurance, maintenance, financing, road taxes, and local electricity or fuel prices.
- Payload figures are indicative planning ranges for complete vehicles and should be checked against axle limits, braking performance, battery size, terrain, and local regulations.
- For e-commerce, route density and the number of daily stops are often more important than maximum speed; compact low-emission vehicles are particularly effective for dense last-mile networks.
Assumptions: Energy-cost examples use stated electricity and fuel prices and exclude labor, depreciation, maintenance, taxes, and charging or refueling losses. Specifications vary by configuration, road conditions, climate, load, and jurisdiction.
Reverse Trikes: Safety Ratings, Engine Output, and Premium Buyer Demand
Reverse trikes are attracting global buyers who want motorcycle freedom with a wider front stance. Their two front wheels can improve braking stability and cornering confidence. However, safety ratings are not uniform across countries. Some markets test three-wheeled vehicles separately, while others offer limited public data. A reliable comparison should examine crash protection, braking performance, lighting, restraints, and electronic stability systems.
Engine output also changes the ownership experience. A compact engine may produce enough power for city traffic and short touring. Larger engines deliver stronger acceleration, especially with two riders and luggage. Yet more power can expose weaknesses in tires, suspension, and braking calibration. Power-to-weight figures matter more than headline horsepower. A test ride should include tight bends, rough pavement, and emergency braking. Real roads are less forgiving.
Premium buyers often expect refined materials, quiet operation, precise controls, and dependable service support. They may pay more for adaptive suspension, improved wind protection, and advanced rider assistance. Still, luxury pricing does not guarantee superior safety. That assumption deserves scrutiny. A costly vehicle can remain tiring in heavy traffic or awkward during low-speed parking. Buyers should compare independent test results, warranty terms, repair access, and long-term parts availability. Personal comfort also matters. A technically impressive reverse trike may feel too wide, too firm, or simply unfamiliar after an hour.
Global Comparison: Price, Operating Cost, Regulations, and Use-Case Data
What Are the Top Three Wheeled Vehicles for Global Buyers?
Global Comparison: Price, Operating Cost, Regulations, and Use-Case Data
Global buyers usually compare three practical formats: electric utility tricycles, motor trikes, and enclosed three-wheel microcars. Electric utility tricycles often cost about $1,500–$6,000 before taxes. They suit market deliveries, farms, and short urban routes. Motor trikes generally range from $3,000–$12,000. They offer stronger carrying capacity and longer range. Enclosed microcars can exceed $8,000, but provide better weather protection. Prices vary sharply by battery size and local certification.
The IEA’s Global EV Outlook 2024 identifies two- and three-wheelers as the largest electric road-vehicle segment by sales. Battery prices also matter. BloombergNEF’s Electric Vehicle Outlook 2024 reported an average battery-pack price of $115 per kilowatt-hour. A small electric trike using 6–12 kWh per 100 kilometers may spend roughly $0.90–$1.80 on electricity. That assumes electricity costs $0.15 per kilowatt-hour. A gasoline motor trike may cost $4–$7 for the same distance. Maintenance is often simpler electrically, though battery replacement remains a difficult long-term estimate.
Regulations can change the purchase decision. European classifications such as L5e and L7e influence power, weight, safety equipment, and registration requirements. Other markets may require motorcycle licenses, helmets, insurance, or commercial permits. Always check local rules. A delivery operator needs cargo volume and repair access. A commuter needs weather protection and parking space. My practical concern is overlooked: low purchase price can hide weak brakes, limited parts supply, or poor resale value.